Swing trading strategies with MACD divergence offer a unique approach to maximizing profits in the trading world. By delving into the intricacies of this strategy, traders can uncover hidden opportunities and gain a competitive edge in the market.
Exploring the fundamentals of swing trading and MACD divergence sets the stage for a journey filled with insights and practical tips to elevate your trading game.
Introduction to Swing Trading Strategies with MACD Divergence
Swing trading is a trading strategy that aims to capture short to medium-term gains in a stock (or any financial instrument) over a period of a few days to several weeks. On the other hand, MACD (Moving Average Convergence Divergence) is a popular technical indicator used by traders to identify trends and potential trend reversals in the market.
Importance of Using MACD Divergence in Developing Swing Trading Strategies
MACD Divergence is crucial in the development of swing trading strategies as it helps traders to identify potential trend reversals accurately. By analyzing the relationship between the MACD line and the signal line, traders can anticipate changes in momentum and price direction, allowing them to enter and exit trades at optimal points.
MACD Divergence occurs when the MACD line and the price action move in opposite directions, signaling a potential reversal in the current trend.
How MACD Divergence Can Help Traders Identify Potential Trend Reversals
- MACD Divergence can help traders spot overbought or oversold conditions in the market, indicating a possible reversal in the price trend.
- Traders can use MACD Divergence to confirm the strength of a trend by looking for divergence between the indicator and the price action.
- By combining MACD Divergence with other technical analysis tools, traders can enhance the accuracy of their entry and exit points in swing trading strategies.
Understanding MACD Indicator

The Moving Average Convergence Divergence (MACD) is a popular technical analysis indicator used by traders to identify potential trend changes in the price of an asset. It is a trend-following momentum indicator that shows the relationship between two moving averages of a security’s price.
Calculation of MACD Indicator
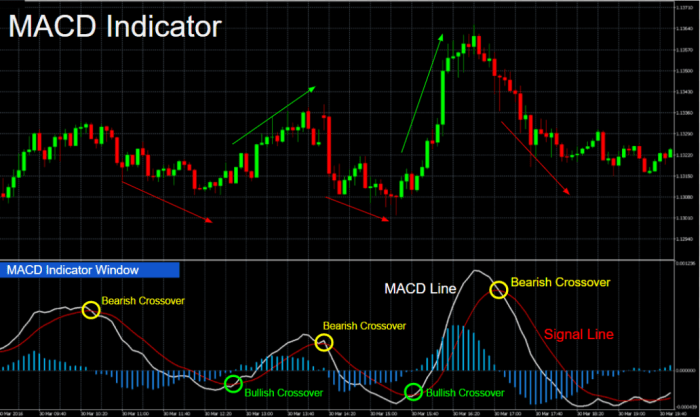
The MACD is calculated by subtracting the 26-period Exponential Moving Average (EMA) from the 12-period EMA. The result is the MACD line. Additionally, a 9-period EMA of the MACD line is plotted to create the signal line.
Components of MACD Indicator
The MACD indicator consists of three main components:
- MACD Line: The MACD line is the 12-period EMA minus the 26-period EMA.
- Signal Line: The 9-period EMA of the MACD line.
- Histogram: The histogram represents the difference between the MACD line and the signal line.
Interpreting MACD Signals
- When the MACD line crosses above the signal line, it is considered a bullish signal, indicating a potential uptrend.
- Conversely, when the MACD line crosses below the signal line, it is seen as a bearish signal, suggesting a possible downtrend.
- Traders also look for divergences between the MACD line and the price of the asset, as these can signal potential trend reversals.
Incorporating Divergence in Swing Trading Strategies

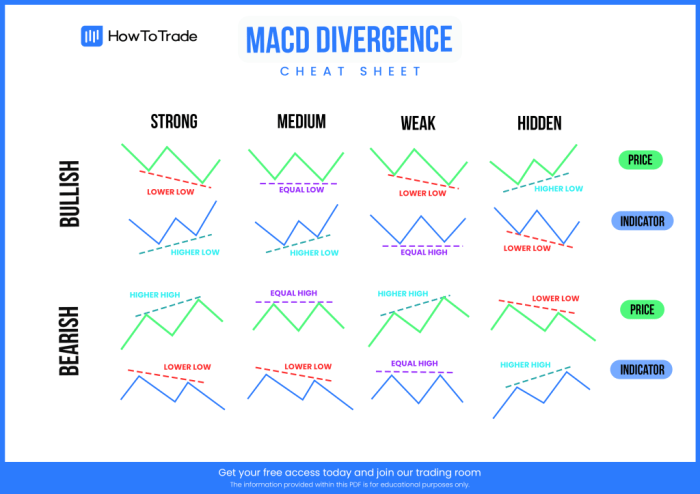
Divergence in trading refers to a situation where the price of an asset moves in the opposite direction of a technical indicator, such as the MACD. This can signal potential trend reversals or momentum shifts in the market.When it comes to the MACD indicator, there are two main types of divergences that traders look out for: bullish and bearish divergences.
A bullish divergence occurs when the price of an asset makes lower lows, while the MACD indicator forms higher lows. This could indicate that the downtrend is losing momentum and a potential reversal to an uptrend might be on the horizon.
On the other hand, a bearish divergence happens when the price makes higher highs, but the MACD indicator forms lower highs. This suggests that the uptrend may be weakening, and a possible trend reversal to a downtrend could occur.Traders can spot MACD divergences on price charts by looking for discrepancies between the price movement and the MACD indicator.
By paying attention to these divergences, traders can potentially anticipate trend changes and make informed decisions when executing swing trading strategies.
Examples of MACD Divergences, Swing trading strategies with MACD divergence
- Example 1: A stock’s price is making lower lows, but the MACD indicator is forming higher lows. This could be a bullish divergence signaling a potential shift from a downtrend to an uptrend.
- Example 2: The price of a currency pair is making higher highs, while the MACD indicator is forming lower highs. This bearish divergence could indicate a weakening uptrend and a possible reversal to a downtrend.
Developing Effective Swing Trading Strategies with MACD Divergence
Swing trading strategies using MACD divergence can be a powerful tool for traders looking to capitalize on market momentum shifts. By combining the MACD indicator with divergence signals, traders can identify potential trend reversals and take advantage of profitable opportunities in the market.
Creating a Swing Trading Strategy with MACD Divergence
- Start by identifying the trend using the MACD indicator and looking for divergence between the price action and the MACD line.
- Confirm the divergence signal with other technical analysis tools such as trendlines, support and resistance levels, or moving averages.
- Set clear entry and exit points based on the MACD divergence signals to manage risk effectively.
- Consider using stop-loss orders to protect your capital and secure profits as the trade moves in your favor.
Conclusive Thoughts

In conclusion, mastering the art of swing trading strategies with MACD divergence can lead to enhanced decision-making and improved trading outcomes. By integrating these techniques into your trading arsenal, you can navigate the market with confidence and precision.
Questions Often Asked: Swing Trading Strategies With MACD Divergence
What is the significance of MACD divergence in swing trading?
MACD divergence plays a crucial role in identifying potential trend reversals and offering valuable insights into market dynamics.
How can traders effectively incorporate MACD divergence into their strategies?
Traders can integrate MACD divergence by combining it with other technical analysis tools for confirmation and setting entry/exit points based on MACD signals.
What are the different types of MACD divergences and how do they impact swing trading?
Bullish and bearish MACD divergences have distinct implications for swing trading, providing traders with key signals to make informed decisions.


